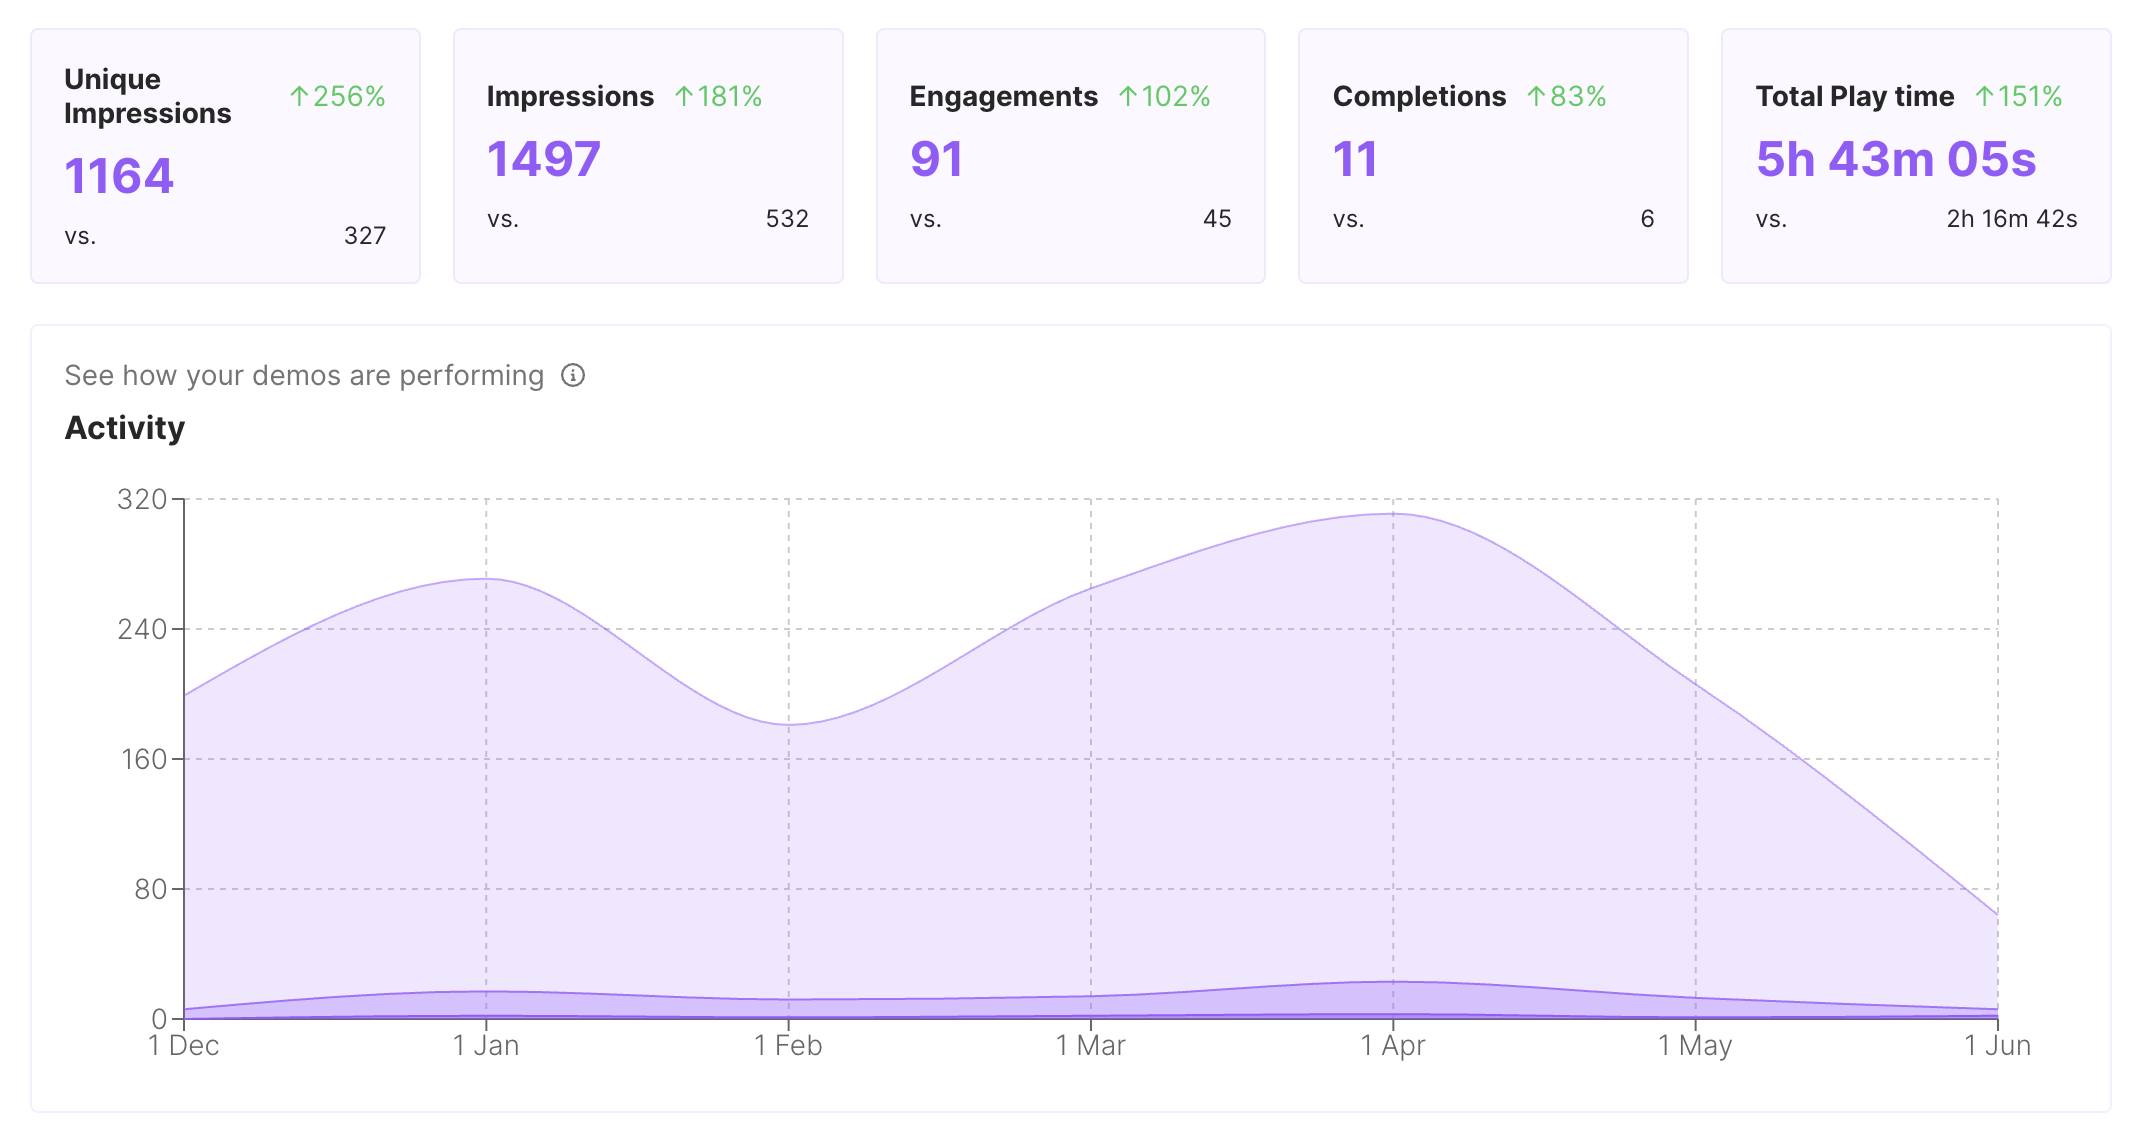
A view means someone opened a link. It doesn't tell you whether the demo did its job. The number that does is how far people got — specifically, whether they reached the step the demo exists to explain.
Start there, because it changes what you do next. Views go up when you promote the demo. Completion goes up when you improve it.
Name the step that matters before you look at any data
Every demo has one moment it was built for. The pricing calculator producing a number. The report rendering. The integration connecting. Everything before that is setup.
Write that step down first. Then your engagement question becomes specific and answerable: what share of people who started reached step 6?
Without naming it, you'll end up reading a completion percentage across the whole demo and treating a drop at the last step the same as a drop at the second. Those mean opposite things. Someone who leaves at the final step usually got what they came for. Someone who leaves at step two never found out what the demo was about.
The four numbers worth reading
Starts. How many people began the demo, not how many pages loaded. If your demo is embedded on a busy page, this gap is large and worth knowing — a demo nobody starts is a placement problem, not a content problem.
Step drop-off. Where people stop, step by step. This is the one that tells you what to change. A cliff at a single step is a specific defect: an unclear instruction, a step that asks too much, or a screen that looks like the end.
Completion of the step that matters. Your real conversion. Read it against starts, not against views.
Time per step. Useful as a shape, not a target. A step that takes far longer than its neighbors is either dense or confusing, and you can usually tell which by reading it again.
That's the set. Adding more numbers to a demo report rarely adds a decision.
What the shape of drop-off tells you
Three patterns come up repeatedly, and each has a different fix.
A cliff at one step. Something specific is wrong there. Open that step and read it as a stranger. Most cliffs are an instruction that assumed context the viewer doesn't have.
A steady slide from the start. No single defect — the demo is longer than the interest it earned. The fix is cutting, not clarifying. Find the step that delivers the promise and cut behind it.
A drop at step one or two. The demo isn't the problem. The framing around it is. People arrived expecting something else, which points at the link text, the page section, or the heading above the embed.
For example: a demo where 70% of starters reach step three and 15% reach step four has a step-four problem you can read and rewrite this afternoon. A demo that loses 10% at every step has a length problem, and no rewrite of any single step fixes it.
What step-level data can't tell you
This is the part most analytics pages skip.
It doesn't tell you why. Drop-off is a location, not a reason. The step is where you look, not what's wrong. Two people leaving at the same step can be leaving for opposite reasons.
It doesn't measure conviction. Someone can finish a demo and think the product isn't for them. Completion is attention, not intent.
It doesn't attribute revenue. A demo that a buyer opened twice before a deal closed didn't cause the deal, and nothing in a demo tool can prove it did. Treat engagement as a signal for follow-up timing and for improving the demo — not as pipeline math.
Small numbers say nothing. A demo with 30 starts has drop-off that moves on noise. Wait for a number you'd defend to a skeptic before you rewrite anything.
We don't publish benchmark completion rates, and you should be careful with anyone who does. A "good" completion rate depends on the demo's length, its placement, and the traffic in front of it. Compare your demo to its own previous version. That comparison is real.
Turning the numbers into an edit
The loop is short:
- Name the step that matters. One step, written down.
- Read step drop-off, not views. Find the largest single drop.
- Change one thing. The instruction, the step order, or the length — one, so the next reading means something.
- Wait for a comparable number of starts. Same placement, same traffic source.
- Compare against the previous version, not a benchmark.
Most demos improve fastest on step three the first two times, then on length.
How Arclet fits
Arclet tracks completion at the step level. You can see which steps viewers completed, where they stopped, how long they spent on each screen, and viewer-level session detail — which is what makes "the largest single drop" a thing you can read rather than infer.
That's also why the demo above is worth clicking before the rest of this page: the boundaries you moved through are the boundaries the data is counted at.
If you're publishing demos across a product's lifecycle and want the wider frame, demo software for SaaS covers where each demo sits. If a demo you're measuring turns out to be too long, cutting a demo that grew too long is the repair procedure.