Measure

Know which steps earned attention before you follow up.

See which steps viewers complete, where they drop off, and how long they spend on each screen. Use engagement data to improve the demo and time your follow-up.

See what engagement data looks like.

Walk through a product demo and understand what step-level analytics reveal about viewer intent.

Completion

See which steps viewers complete and where they stop.

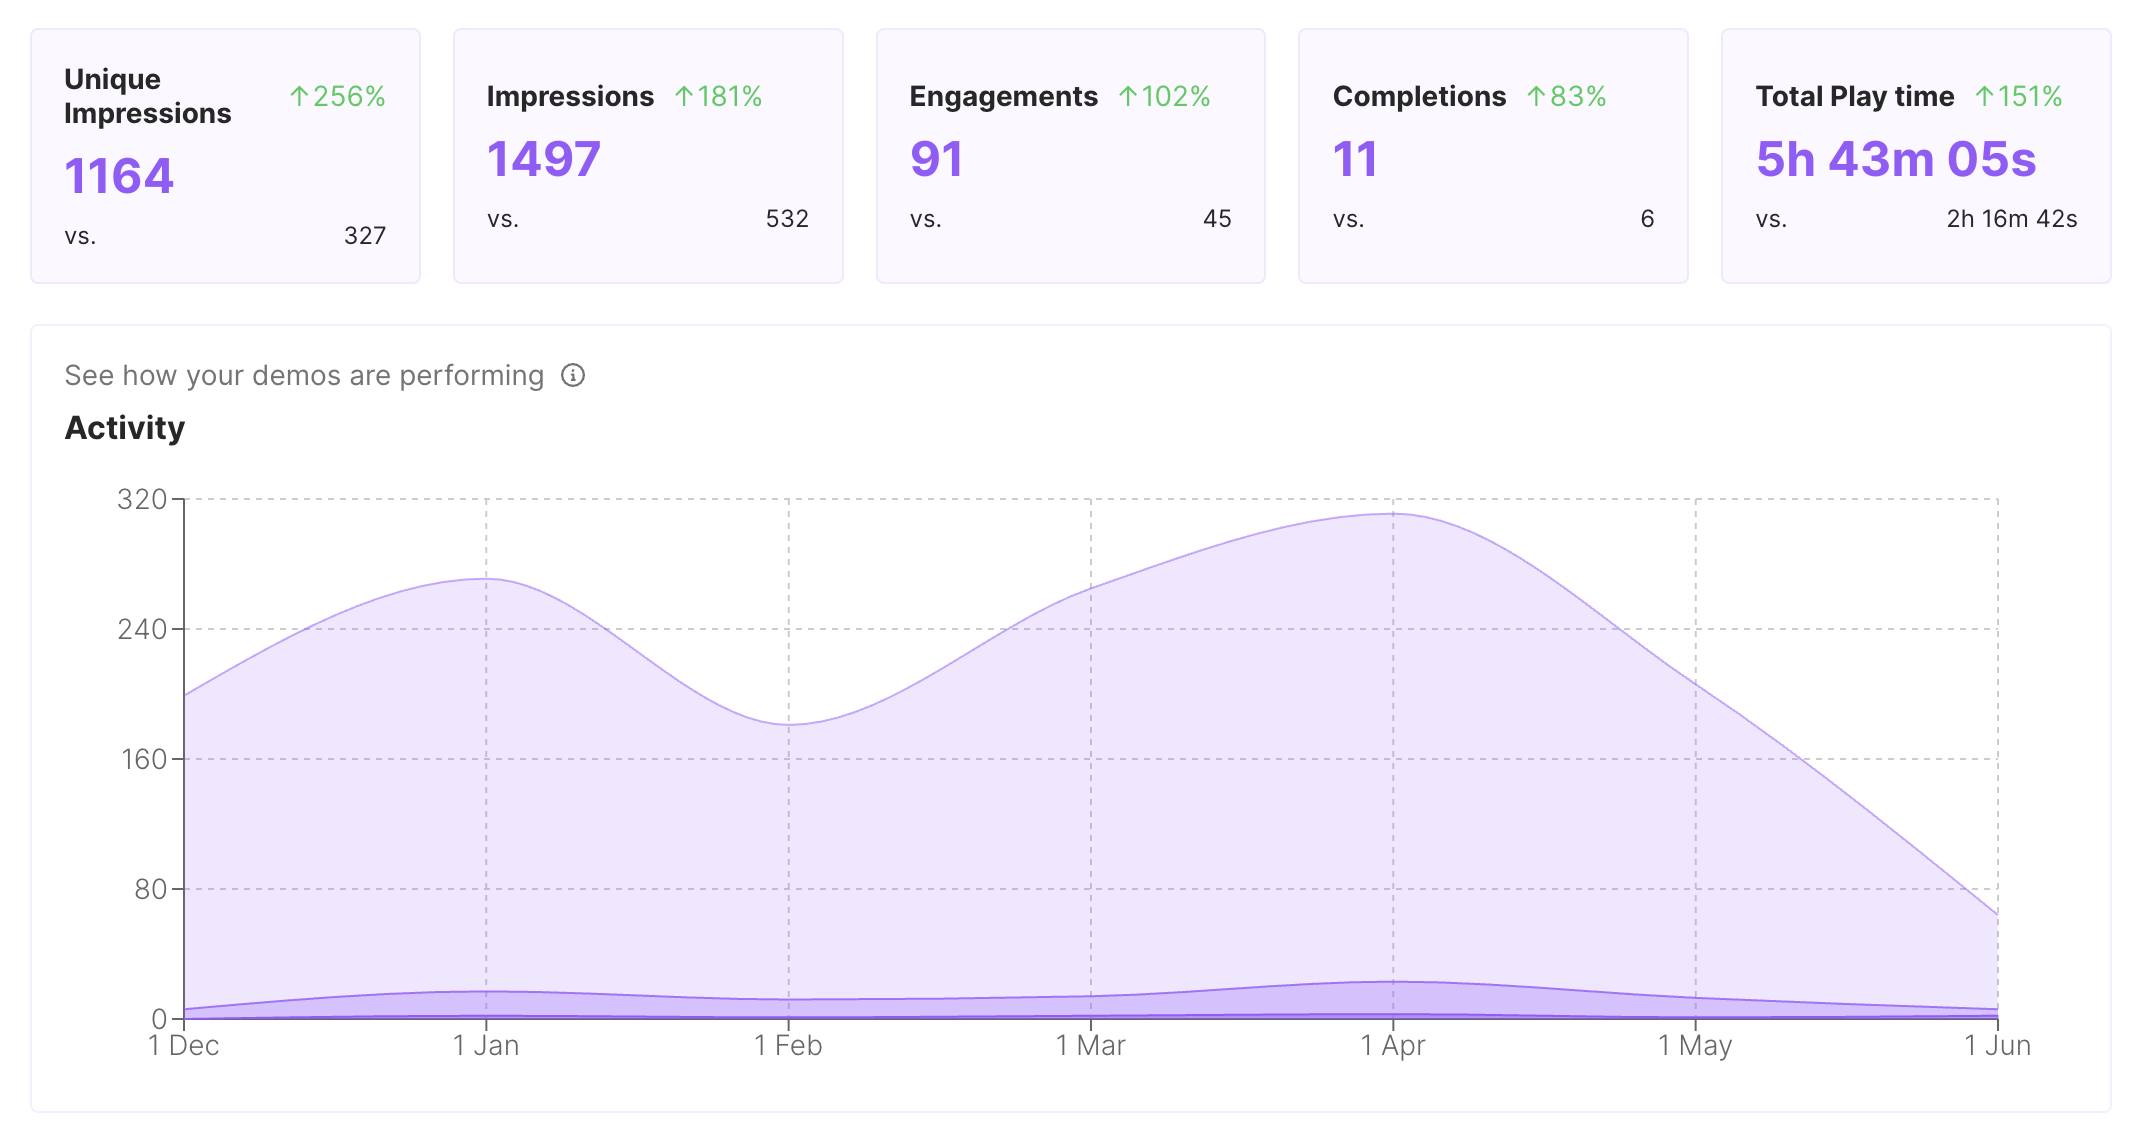
Arclet tracks completion at the step level. You can see exactly which steps a viewer reached and which one caused them to stop. That information is more useful than a simple "opened the link" signal.

  • Per-step completion data
  • Drop-off identification
  • Viewer-level session detail
Arclet analytics dashboard showing step completion rates for a demo

Attention

Find out how long each screen held their focus.

Time spent on each step is a proxy for interest. Steps where viewers pause longer are often the ones worth referencing in your follow-up. Steps where viewers rush through may need clearer tooltip copy.

  • Dwell time per step
  • Interest signal for follow-up
  • Copy improvement cue from data
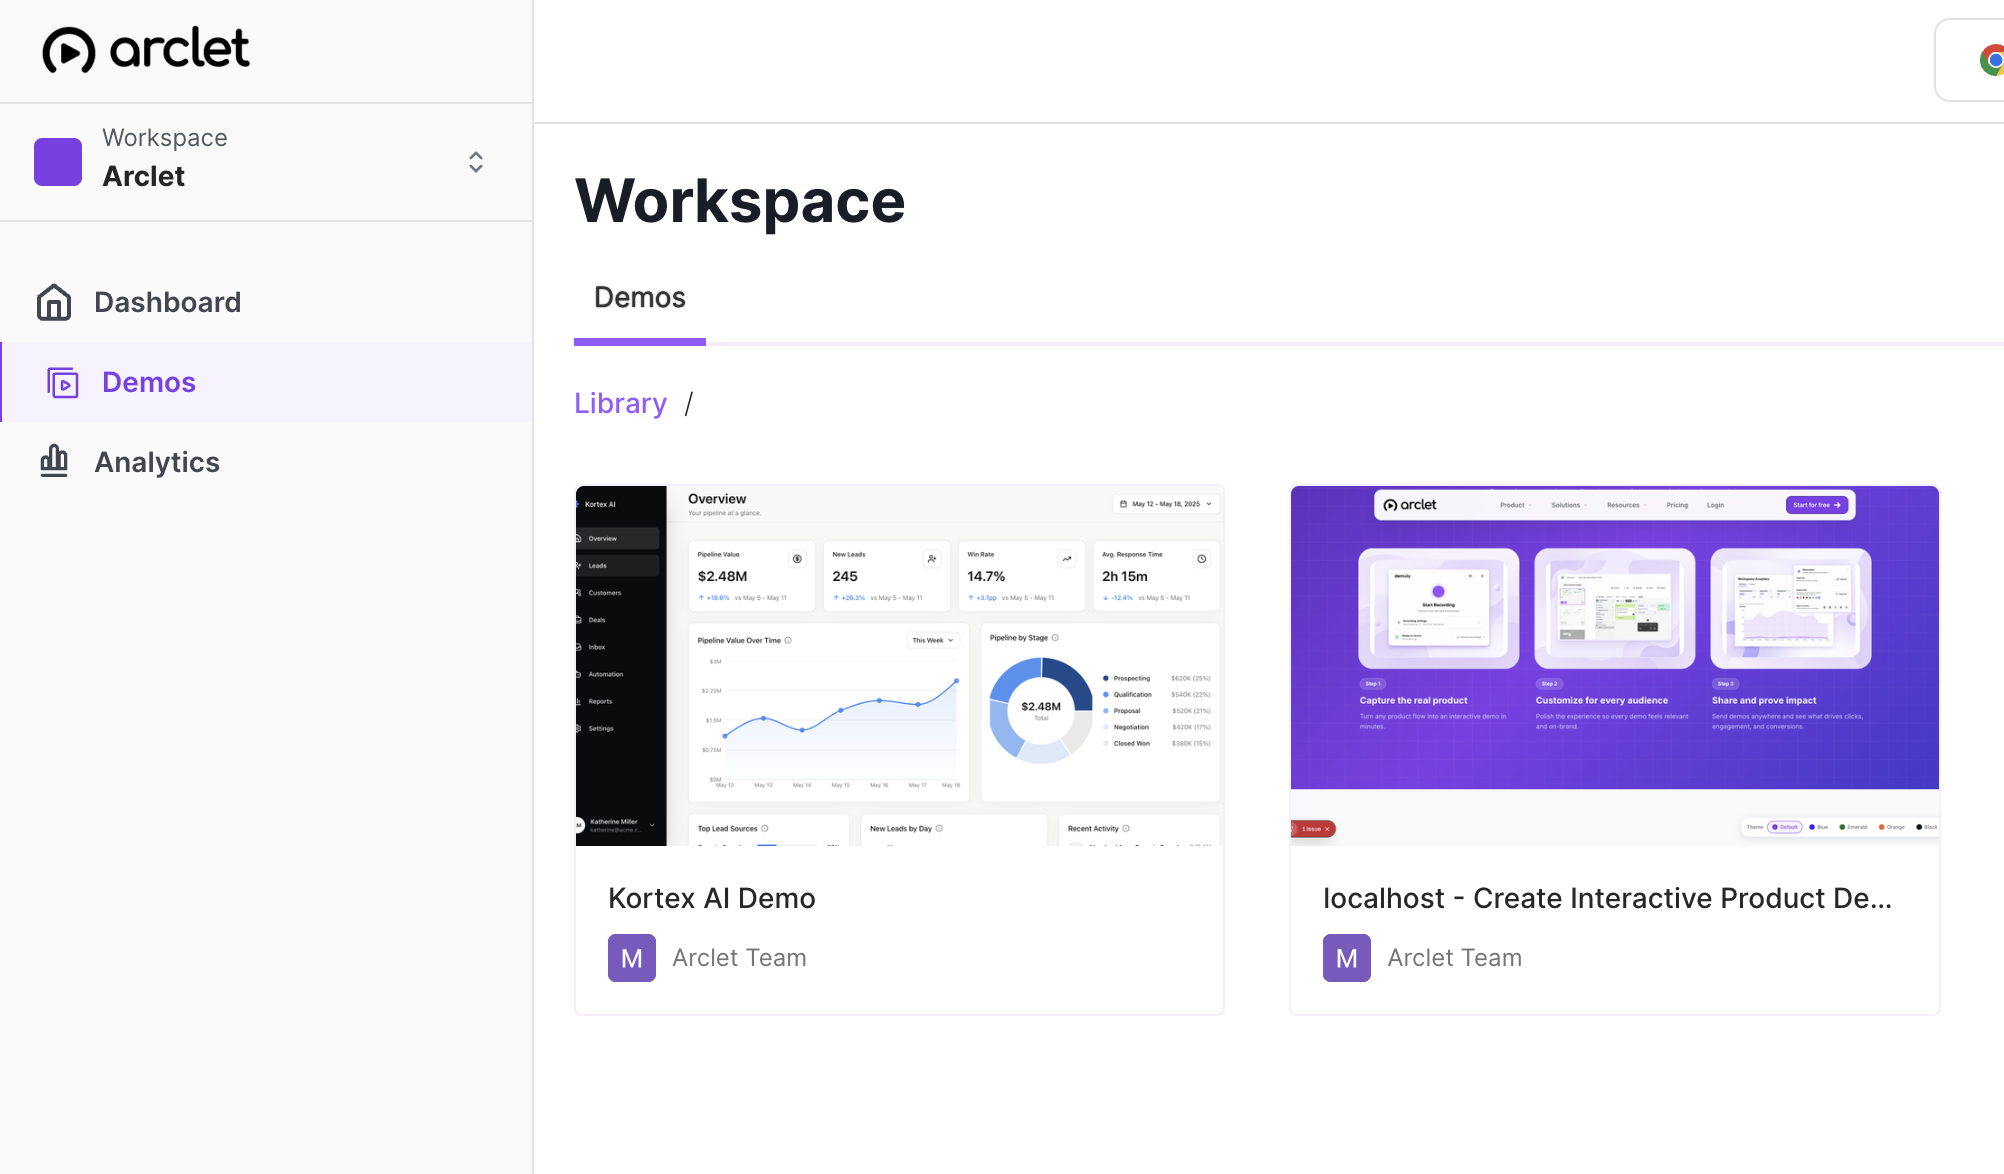
Arclet demo library with engagement stats visible alongside demo cards

Improvement

Use engagement data to sharpen the demo, not just the follow-up.

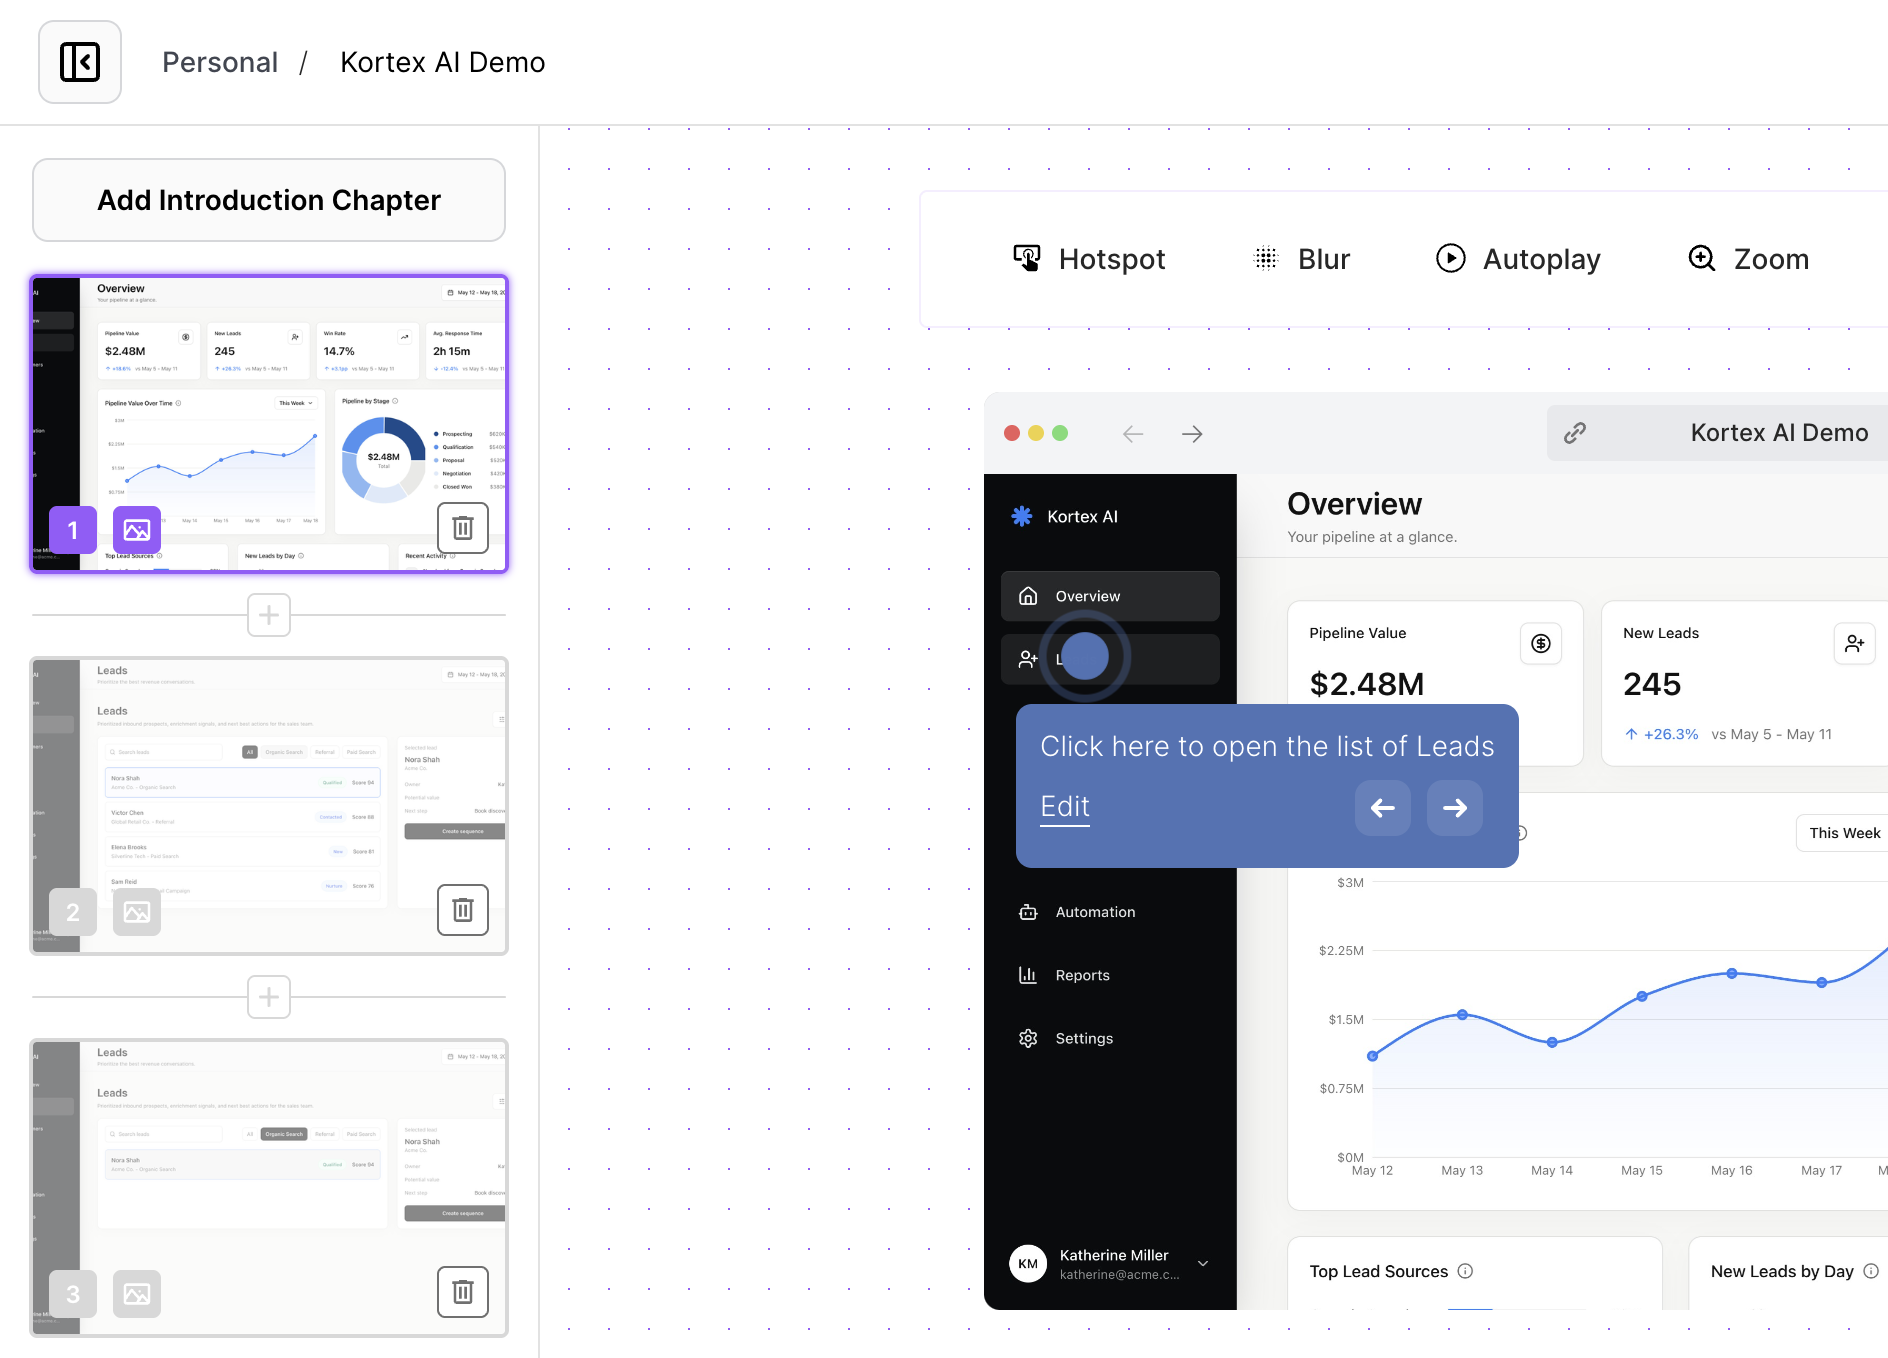
Engagement patterns across multiple viewers reveal which parts of the demo are landing and which are not. When the same step repeatedly causes drop-off, the demo can be improved — reorder steps, rewrite copy, or add a clearer next action.

  • Multi-viewer pattern analysis
  • Demo improvement loop
  • Engagement-informed editing
Arclet editor open for refining a step based on engagement data

Explore other features.

Your first demo is 5 minutes away.

Start free, record a real workflow, and publish a demo people can click through.

Frequently asked questions

Everything you need to know to get started today.