Free toolNo signup · Nothing you type is sent
LTV calculator: what a customer is worth
Enter revenue per account, gross margin and monthly churn to estimate what an average customer is worth over their lifetime, and compare it with what they cost to win. It runs in your browser and sends nothing.
- LTV and LTV:CAC
- Uses gross margin
- Share your numbers
Try it now
Change any number. The results update as you type.
Show your product as an interactive demo people can click through, free to get started.
Start for freeHow it works
Estimate customer lifetime value
Enter revenue per account, gross margin and monthly churn to estimate what an average customer is worth over their lifetime, and compare it with what they cost to win. It runs in your browser and sends nothing.
Step 1
Enter revenue and margin
Type what an average account pays each month in Average revenue per account (monthly), and your Gross margin as a percentage.
Step 2
Enter churn and CAC
Add the share of customers who cancel each month in Monthly churn, and what a customer costs to win in Customer acquisition cost (CAC).
Step 3
Read LTV and the ratio
Customer lifetime value (LTV) is the gross profit you can expect from one customer. LTV to CAC ratio shows how many times it covers the cost of winning them.
The example the tool opens with
The tool opens with a subscription product that keeps most of its customers each month. The walk-through below uses the same numbers.
- Average revenue per account (monthly)
- $150
- Gross margin
- 80%
- Monthly churn
- 2%
- Customer acquisition cost (CAC)
- $1,250
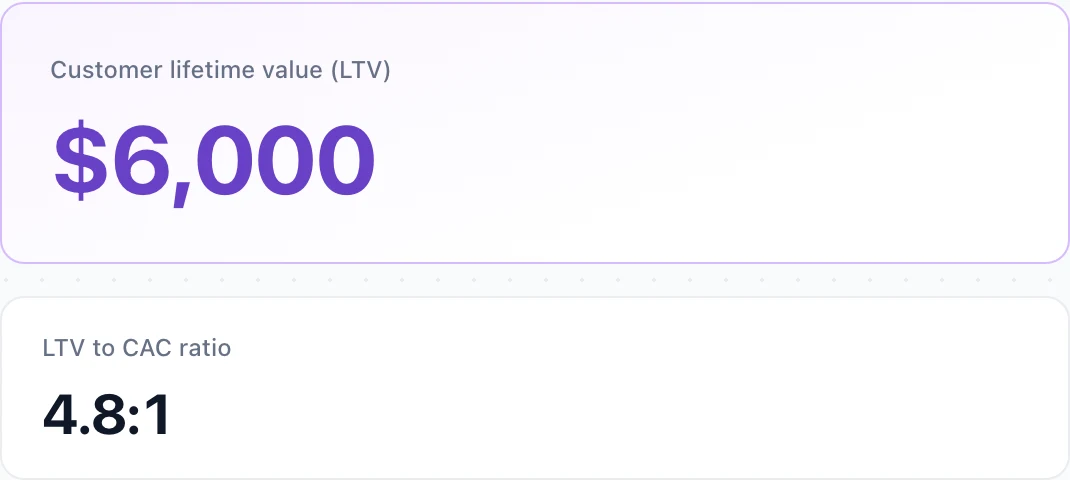
- Customer lifetime value (LTV)
- $6,000
- LTV to CAC ratio
- 4.8:1
How customer lifetime value is calculated
The formula
Customer lifetime value is average monthly revenue per account, multiplied by gross margin, divided by monthly churn.
An account paying $150 a month at an 80% margin gives $120 of gross profit a month. At 2% monthly churn, $120 divided by 0.02 is $6,000. The same churn rate implies a customer stays for 50 months on average, since 1 divided by 0.02 is 50.
Margin-adjusted, not revenue
Some LTV figures use revenue and skip margin. On the numbers above that gives $150 divided by 0.02, or $7,500, which is $1,500 more than the margin-adjusted $6,000. The gap grows as margins fall.
Revenue does not pay for hosting, support or payment fees. Margin-adjusted LTV is the figure you can compare with CAC, because CAC is also a cost.
What happens at zero churn
The formula divides by churn, and dividing by zero has no answer. With no customers cancelling, the model says a customer lasts forever and is worth an unlimited amount.
The tool shows a message in place of a number when churn is 0%. If you have little churn history, enter the rate you expect, since a measured zero over a few months is a short sample and not a promise.
LTV to CAC
The ratio divides lifetime value by acquisition cost. With $6,000 of LTV and $1,250 of CAC, it is 4.8:1, so each customer is expected to return 4.8 times what it cost to win them.
The ratio does not say how long that takes. Pair it with the CAC payback figure from the CAC calculator, since a high ratio over a very long lifetime can strain cash.
Read the ratio with the same care as its parts. A strong ratio can come from a generous churn estimate as easily as from a low CAC, so check which of the two is doing the work before you rely on it. Changing churn from 2% to 3% in this tool takes LTV from $6,000 to $4,000, and the ratio from 4.8:1 to 3.2:1.
Where the inputs go wrong
Monthly and annual churn are easy to mix up. A 2% monthly rate is not 2% a year. Compounded over 12 months, 2% a month loses about 21.5% of customers, so enter the monthly figure here.
A young cohort has not had time to churn, so early churn tends to flatter LTV. Blending plans hides differences too: a cheap plan that churns quickly and an annual plan that rarely does should not share one average.
Customer lifetime as a sanity check
Dividing 1 by monthly churn gives an expected lifetime in months, and it is worth reading on its own. A figure of 50 months only holds if the product, the price and the market stay the same for four years, which few do.
If the lifetime looks longer than your company has existed, treat the LTV as a model and not a measurement. The estimate is most useful for comparing plans or segments with each other, where the same assumption applies to both.
Comparing your number
Published LTV and LTV to CAC figures depend on how each company defines lifetime, margin and churn, and those definitions differ widely. They are hard to compare with your own unless the method is stated.
Compare your own figure across quarters and across customer segments, using one method throughout.
See how Arclet tracks demo engagementFrequently asked questions
Everything you need to know to get started today.
More free tools
CAC calculator
Divide sales and marketing spend by new customers, and see how long a customer takes to pay it back.
Win rate calculator
Work out your win rate and how many deals you need to work to hit a revenue target.
NRR calculator
Calculate net revenue retention and gross revenue retention from a customer cohort.
All free tools
Every screenshot tool on one page.
Screenshots show a moment. Demos show the whole flow.
Record a workflow once in your browser and share a demo people can click through.