Free toolNo signup · Nothing you type is sent
NRR calculator: net and gross revenue retention
This net revenue retention calculator shows how much of last period revenue you kept from the same customers, with and without upgrades. Enter four MRR figures. Nothing you type leaves your browser.
- NRR and GRR together
- Shows retention above 100%
- Share your numbers
Try it now
Change any number. The results update as you type.
Show your product as an interactive demo people can click through, free to get started.
Start for freeHow it works
Calculate net revenue retention
This net revenue retention calculator shows how much of last period revenue you kept from the same customers, with and without upgrades. Enter four MRR figures. Nothing you type leaves your browser.
Step 1
Enter your starting revenue
Put the monthly recurring revenue from the customers you had at the start of the period in Starting MRR. Leave out customers who joined later.
Step 2
Enter what changed
Fill in Expansion MRR for upgrades and add-ons, Contraction MRR for downgrades, and Churned MRR for customers who cancelled. All come from the same starting customers.
Step 3
Read NRR and GRR
Net revenue retention (NRR) includes expansion. Gross revenue retention (GRR) leaves it out, so it shows only what you kept.
The example the tool opens with
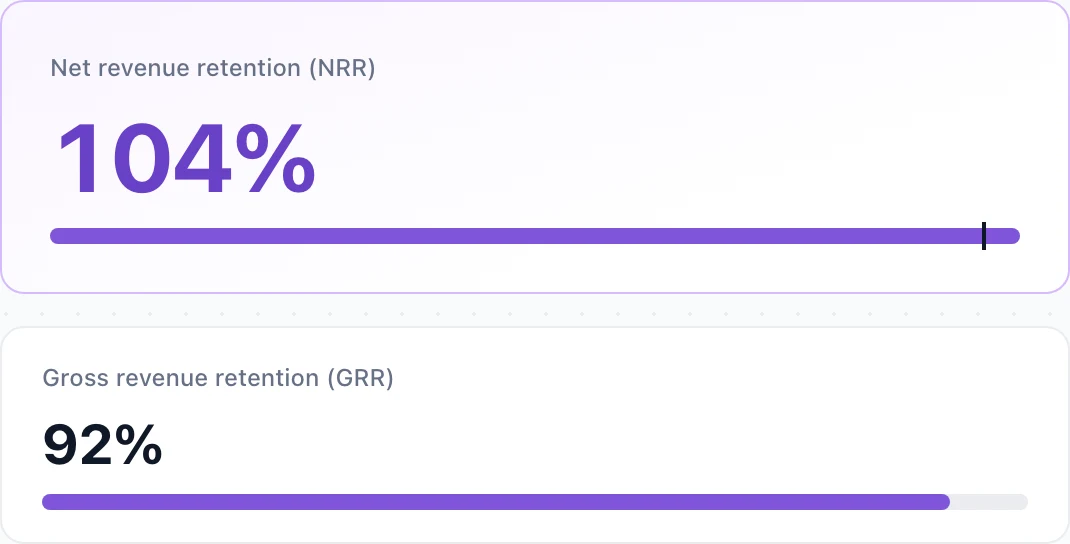
The tool opens with one cohort and its MRR a year on. The walk-through below uses the same numbers.
- Starting MRR
- $100,000
- Expansion MRR
- $12,000
- Contraction MRR
- $3,000
- Churned MRR
- $5,000
- Net revenue retention (NRR)
- 104%
- Gross revenue retention (GRR)
- 92%
How net revenue retention is calculated
The formula
Net revenue retention takes the revenue from a fixed group of customers at the start, adds the expansion from them, subtracts the contraction and churn from them, and divides by the starting revenue.
Starting at $100,000 of MRR with $12,000 of expansion, $3,000 of contraction and $5,000 of churn, the result is $104,000 divided by $100,000, which is 104%.
Gross revenue retention
GRR uses the same cohort but ignores expansion. Here that is $100,000 minus $3,000 minus $5,000, divided by $100,000, or 92%. It cannot go above 100%, because without expansion a cohort can only hold its revenue or lose some.
Gross retention is the harder number to flatter. Expansion can come from a price rise or a few large accounts, but GRR only moves when customers stay and keep paying what they paid. That makes it the better read on whether the product keeps people, separate from how well the account team sells upgrades.
NRR can hide leaks
The example cohort is above 100% and still lost 8% of its starting revenue. Upgrades from some customers covered cancellations from others. A 104% NRR with a 92% GRR is a different business from 104% NRR with 99% GRR, even though the headline matches.
Look at both. NRR tells you whether the base grows by itself, and GRR tells you how much work expansion is doing to cover losses.
Mistakes that distort it
Including revenue from customers who joined during the period is the most common error. It turns a retention measure into a growth measure. Start with who you had on day one and follow only them.
Mixing periods causes trouble too. A quarterly figure and an annual figure are not comparable, and annual NRR is usually measured against the cohort from twelve months before. Price rises counted as expansion, and reactivated customers counted as new or as retained, are worth deciding once and writing down.
Choosing the period
Pick the window before you pull the numbers. For a year-on-year NRR, take everyone who was a customer twelve months ago, sum their MRR then, and sum what the same customers pay now, split into expansion, contraction and churn.
Shorter windows work for tracking, but they give figures that look much closer to 100% than an annual one would. Quarterly NRR of 101% is not the same claim as annual NRR of 101%. Label every figure with its period when you share it, so nobody reads a quarterly number as an annual one.
Published medians
Medians differ because the companies surveyed differ. These are the publishers, with the population each covers.
| Source | Population | Median NRR | Median GRR |
|---|---|---|---|
| Aleph and Benchmarkit, 2026 SaaS and AI Performance Benchmarks (CY-2025 data) | 342 B2B SaaS and AI-native companies surveyed; 230 reported NRR | 102% | 84% |
| SaaS Capital, 2026 Benchmarking Metrics for Bootstrapped SaaS Companies (published 24 April 2026) | Bootstrapped private B2B SaaS companies with $3M to $20M ARR, from a survey of more than 1,000 companies | 103% | 91% |
Where the figures come from
The Aleph and Benchmarkit NRR figure is at getaleph.com/answers/net-revenue-retention-saas-2026 and the GRR figure at getaleph.com/blog/2026-saas-benchmarks-takeaways. The same report found usage-based pricing at a median NRR of 108% and seat-based pricing at 98%. The SaaS Capital figures are at saas-capital.com/benchmarking. All were checked 2026-11-16.
The two sets differ on GRR by seven points, so the population you compare against matters more than the single number.
See how Arclet tracks demo engagementFrequently asked questions
Everything you need to know to get started today.
More free tools
CAC calculator
Divide sales and marketing spend by new customers, and see how long a customer takes to pay it back.
LTV calculator
Estimate customer lifetime value from revenue, margin and churn, and compare it with CAC.
Win rate calculator
Work out your win rate and how many deals you need to work to hit a revenue target.
All free tools
Every screenshot tool on one page.
Screenshots show a moment. Demos show the whole flow.
Record a workflow once in your browser and share a demo people can click through.